There’s something going on for a while and I haven’t seen any mentions of it. Wondering if anyone else is experiencing it.
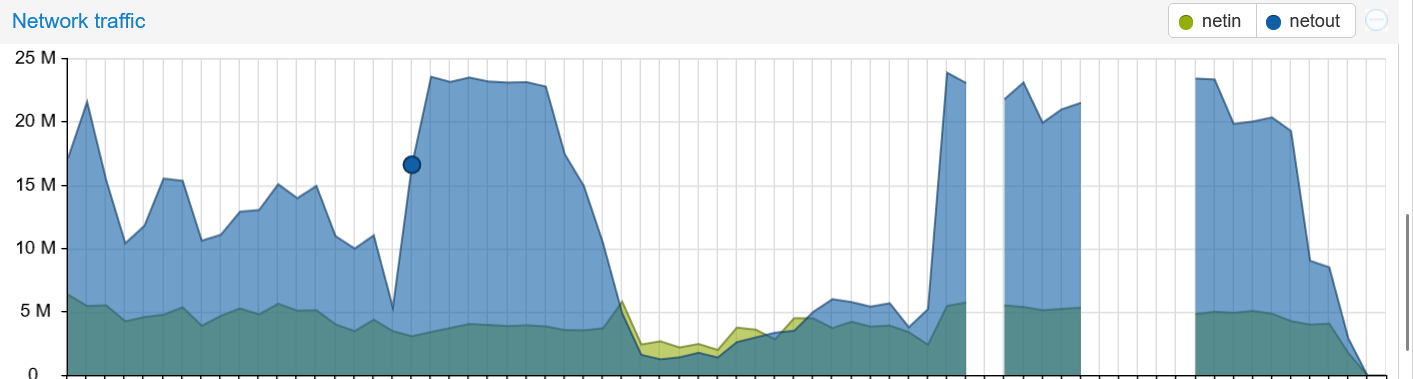
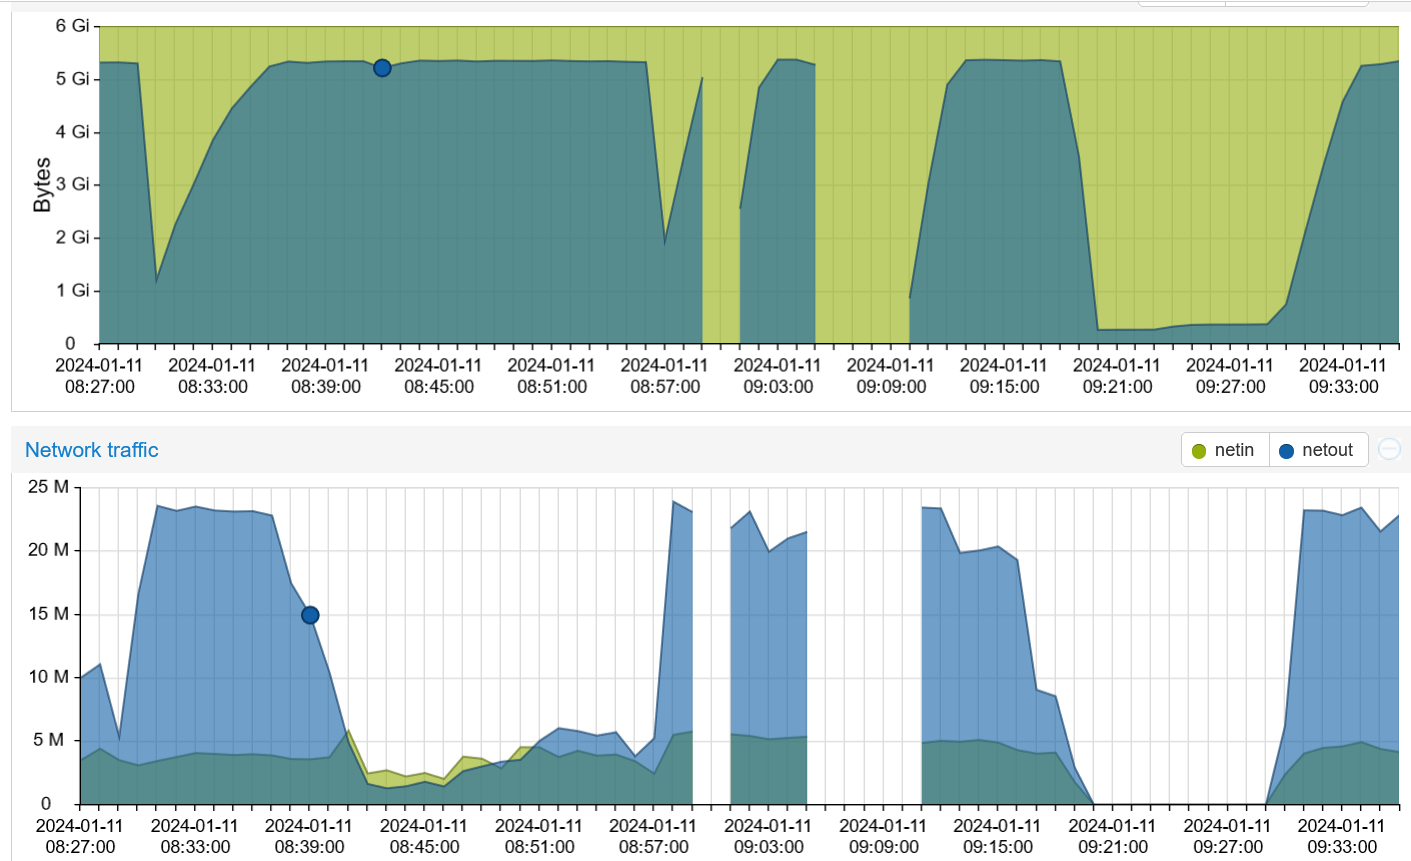
The problem is the huge unreasonable spikes of outgoing packets which cause RAM to max out and eventually causes Tor to crash. The interesting part is that even when you shut down tor and restart it after a few minutes, it start right from where it left off and in about a minute, you’re back where you were. See below:
The gaps are when I shut down Tor and as you can see, the spike happens immediately after the restart even when I start Tor 5 to 7 minutes later. Shouldn’t there be a period when tor establishes new circuits when it restarts? Why does it start where it was left off and continues sending data from previously established connections? Does this mean that this is an attack directly pointed at my specific relay and IP address?
I’m assuming all this traffic is going to one or more exit relay.
Sample log:
Excellent. Publishing server descriptor.
Jan 11 14:00:04.000 [notice] Bootstrapped 100% (done): Done
Jan 11 14:02:22.000 [notice] We're low on memory (cell queues total alloc: 4142541744 buffer total alloc: 304637952, tor compress total alloc: 43280 (zlib: 43264, zstd: 0, lzma: 0), rendezvous cache total alloc: 3465829). Killing circuits withover-long queues. (This behavior is controlled by MaxMemInQueues.)
Jan 11 14:02:28.000 [notice] Removed 448201792 bytes by killing 23077 circuits; 266323 circuits remain alive. Also killed 0 non-linked directory connections. Killed 1 edge connections
Jan 11 14:02:28.000 [warn] connection_edge_about_to_close(): Bug: (Harmless.) Edge connection (marked at src/core/or/circuitlist.c:2747) hasn't sent end yet? (on Tor 0.4.8.10 )
Jan 11 14:02:28.000 [warn] tor_bug_occurred_(): Bug: src/core/or/connection_edge.c:1086: connection_edge_about_to_close: This line should not have been reached. (Future instances of this warning will be silenced.) (on Tor 0.4.8.10 )
Jan 11 14:02:28.000 [warn] Bug: Tor 0.4.8.10: Line unexpectedly reached at connection_edge_about_to_close at src/core/or/connection_edge.c:1086. Stack trace: (on Tor 0.4.8.10 )
Jan 11 14:02:28.000 [warn] Bug:     /usr/bin/tor(log_backtrace_impl+0x5b) [0x55f92817a82b] (on Tor 0.4.8.10 )
Jan 11 14:02:28.000 [warn] Bug:     /usr/bin/tor(tor_bug_occurred_+0x18a) [0x55f928191d7a] (on Tor 0.4.8.10 )
Jan 11 14:02:28.000 [warn] Bug:     /usr/bin/tor(connection_about_to_close_connection+0x6c) [0x55f92823711c] (on Tor 0.4.8.10 )
Jan 11 14:02:28.000 [warn] Bug:     /usr/bin/tor(+0x6cb3e) [0x55f9280f9b3e] (on Tor 0.4.8.10 )
Jan 11 14:02:28.000 [warn] Bug:     /usr/bin/tor(+0x6cee8) [0x55f9280f9ee8] (on Tor 0.4.8.10 )
Jan 11 14:02:28.000 [warn] Bug:     /lib64/libevent-2.1.so.7(+0x24958) [0x7f2b6ad1d958] (on Tor 0.4.8.10 )
Jan 11 14:02:28.000 [warn] Bug:     /lib64/libevent-2.1.so.7(event_base_loop+0x577) [0x7f2b6ad1f2a7] (on Tor 0.4.8.10 )
Jan 11 14:02:28.000 [warn] Bug:     /usr/bin/tor(do_main_loop+0x127) [0x55f9280fdb17] (on Tor 0.4.8.10 )
Jan 11 14:02:28.000 [warn] Bug:     /usr/bin/tor(tor_run_main+0x205) [0x55f928101b35] (on Tor 0.4.8.10 )
Jan 11 14:02:28.000 [warn] Bug:     /usr/bin/tor(tor_main+0x4d) [0x55f928101f5d] (on Tor 0.4.8.10 )
Jan 11 14:02:28.000 [warn] Bug:     /usr/bin/tor(main+0x1d) [0x55f9280f4cad] (on Tor 0.4.8.10 )
Jan 11 14:02:28.000 [warn] Bug:     /lib64/libc.so.6(+0x3feb0) [0x7f2b6a43feb0] (on Tor 0.4.8.10 )
Jan 11 14:02:28.000 [warn] Bug:     /lib64/libc.so.6(__libc_start_main+0x80) [0x7f2b6a43ff60] (on Tor 0.4.8.10 )
Jan 11 14:02:28.000 [warn] Bug:     /usr/bin/tor(_start+0x25) [0x55f9280f4d05] (on Tor 0.4.8.10 )
Jan 11 14:02:34.000 [notice] Performing bandwidth self-test...done.
Jan 11 14:02:58.000 [notice] We're low on memory (cell queues total alloc: 4073659392 buffer total alloc: 369604608, tor compress total alloc: 0 (zlib: 0, zstd: 0, lzma: 0), rendezvous cache total alloc: 3978040). Killing circuits withover-long queues. (This behavior is controlled by MaxMemInQueues.)
Jan 11 14:03:03.000 [notice] Removed 444758160 bytes by killing 23863 circuits; 275706 circuits remain alive. Also killed 0 non-linked directory connections. Killed 0 edge connections
Jan 11 14:03:47.000 [notice] We're low on memory (cell queues total alloc: 4118419008 buffer total alloc: 324532224, tor compress total alloc: 0 (zlib: 0, zstd: 0, lzma: 0), rendezvous cache total alloc: 4539033). Killing circuits withover-long queues. (This behavior is controlled by MaxMemInQueues.)
Jan 11 14:03:50.000 [notice] Removed 445017936 bytes by killing 22438 circuits; 287151 circuits remain alive. Also killed 0 non-linked directory connections. Killed 0 edge connections
I’ve noticed this exact behaviour for the first time last week on one of my nodes. The downtime was very minimal for me though, but can imagine stability is bad for users. Hadn’t really looked into it thus far as it isn’t really an issue for now. Detected it by basic metrics, as you can imagine.
I’ll see later this week if I can see some useful info in the logs. Let me know if I can help.
Well, the downtime may be a lot longer than you imagine. I have set up remote monitoring for my relays and I get a message when the port is unresponsive. In my experience, even though Tor is running, it won’t accept new connections. In my case Tor is unresponsive sometimes for 10 minutes and then it accepts new connections and of course within minutes it’s back to being unresponsive. This keeps on going sometimes for an hour or more.
In other words, you can see traffic but most of it is not new connections. It’s simply busy processing the existing connections initiated by the attack.
I had the same issue on one of my relays. I saw hundreds of short lived connections too. I added these iptables rules and it seems to have helped, but I’m now getting much less throughput through my relay.
The throughput you were previously experiencing included a lot of garbage sent and received due to the attack so it’s reasonable to have less usage once the attackers are blocked.
Once the authorities realize you’re doing less than you’re capable of, you’ll start building new circuits and new users will choose your relays and the throughput will eventually get back up. Only this time, you’ll be processing mostly legitimate connections.
I wonder if this has something to do with what I just experienced.
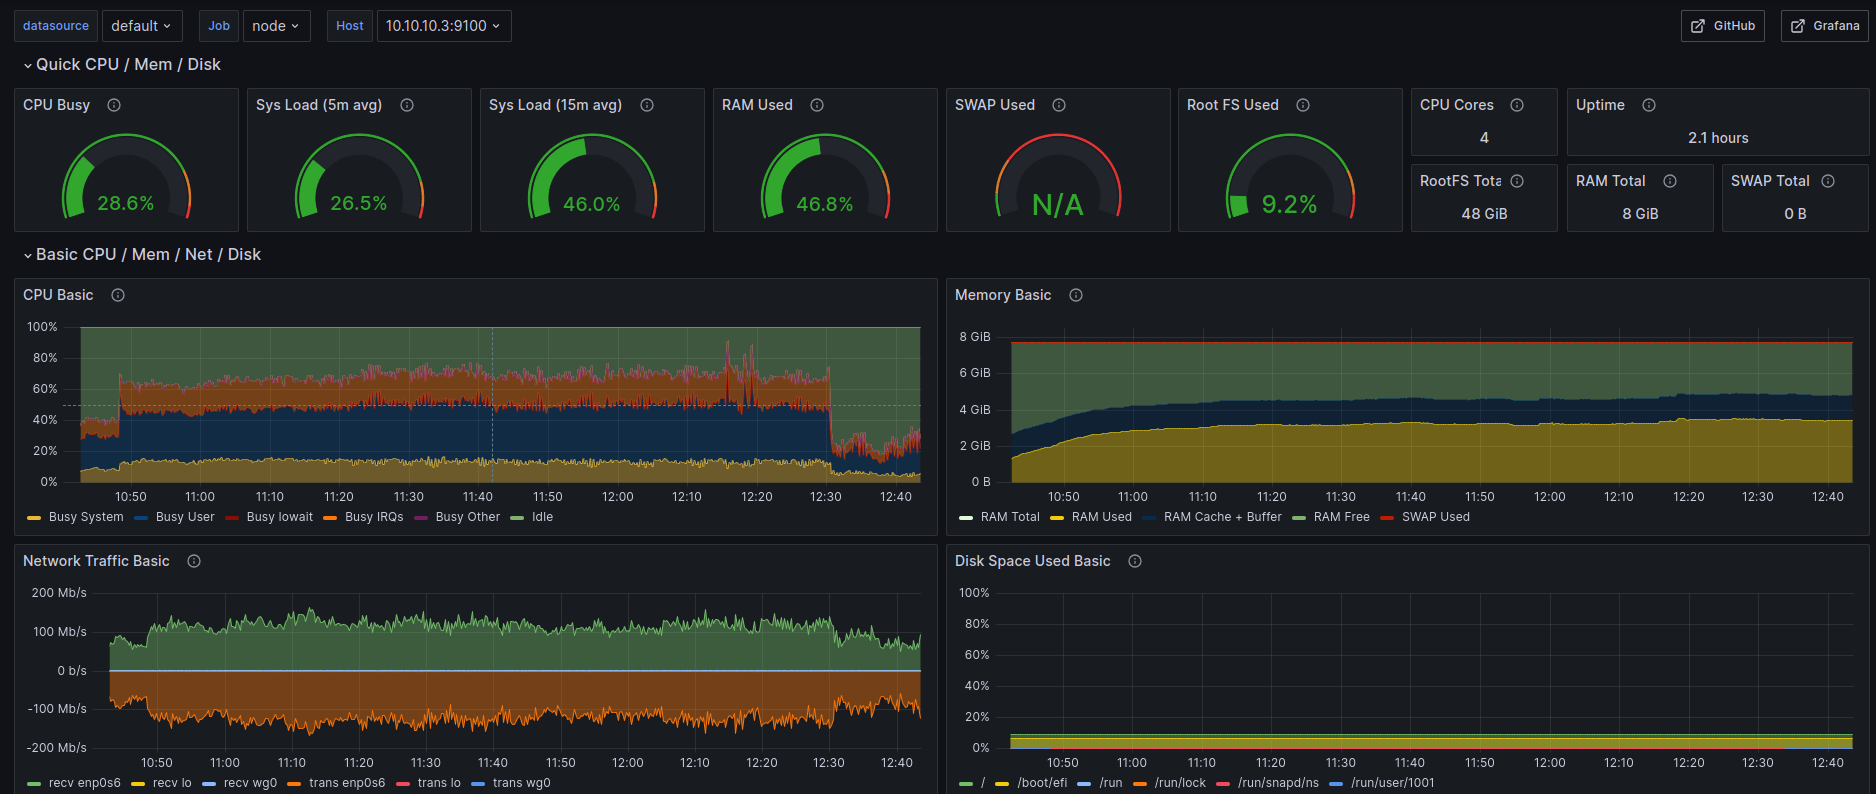
I restarted the machine which hosts a few of my instances so I could solve some VPN connectivity issues. After bootstrapping, you can see how CPU and RAM usage increases (as new circuits are created) and after roughly 2 hours there’s a big drop for no reason, no crashes, no warnings, nothing in logs. Info in Nyx is fine. Now the usage is at 40-55%, not usual, as it used to be at 65-80%.
Despite the CPU usage drop, RAM is still consumed, no drop at all.
The iptables setup doesn’t completely prevent it but it greatly reduces the impact. We’re preventing them from creating multiple connections but they can still pack a punch with the one or two connections they’re allowed.
Remember, some of those packets are coming from other relays and we don’t want to completely ban a lot of other relays in the network.
Well, the iptables script puts a bunch of IP addresses in the block list based on their behavior, mainly due to their attempts to make concurrent connections. Sometimes your relay is the point of entry and sometimes you’re just processing the packets that are coming from other relays under the attack.
There’s so much you can do with iptables. The fact that Tor is getting overloaded for processing the packets tells me that the best way to block this attack would be at the application layer. In other words, Tor should recognize the bogus requests and simply not process them.
Issues are getting worse for me. Almost once per day a relay goes down. Considering creating scripting to restart my relays preventively to reduce downtime. Anyone else seeing the same thing?
I find restarting the service, or even the entire VM doesn’t help. It goes right back into the bad state. I let it ride for a while and it recovered on its own after several OOM kills.
Is there any advise from official Tor devs? Perhaps some config we can change? I’m seeing persistence as well even after reboot. The impact on my relay health is serious now at this point, I have to intervene daily and I have 3 relays now with descriptor errors - which has never happend before. If there is any info I can collect for debugging, let me know.