Hi all,
I’ve been running Tor middle relays for well over a decade now so I like to consider myself pretty experienced with the trials and tribulations of being a relay operator. With that said, I’m seeing some unusual traffic patterns of late which are new to me and I’m wondering if anyone could shed any light on what may be the cause.
My relay maurice (62BAB7516A0D3F1E6B2BC94767592791F6B58FB0), a virtual machine running on Proxmox VE, recently had an unscheduled restart due to a hardware failure on the host machine and was offline for about 36 hours. I remediated the hardware issue and uploaded Tor to the latest version at the same time (0.4.8.5) as bringing the server back online. The guard flag was lost due to the outage but quickly regained upon restarting the server and everything else, as best as I can tell, has remained the same, with the exception of the traffic usage.
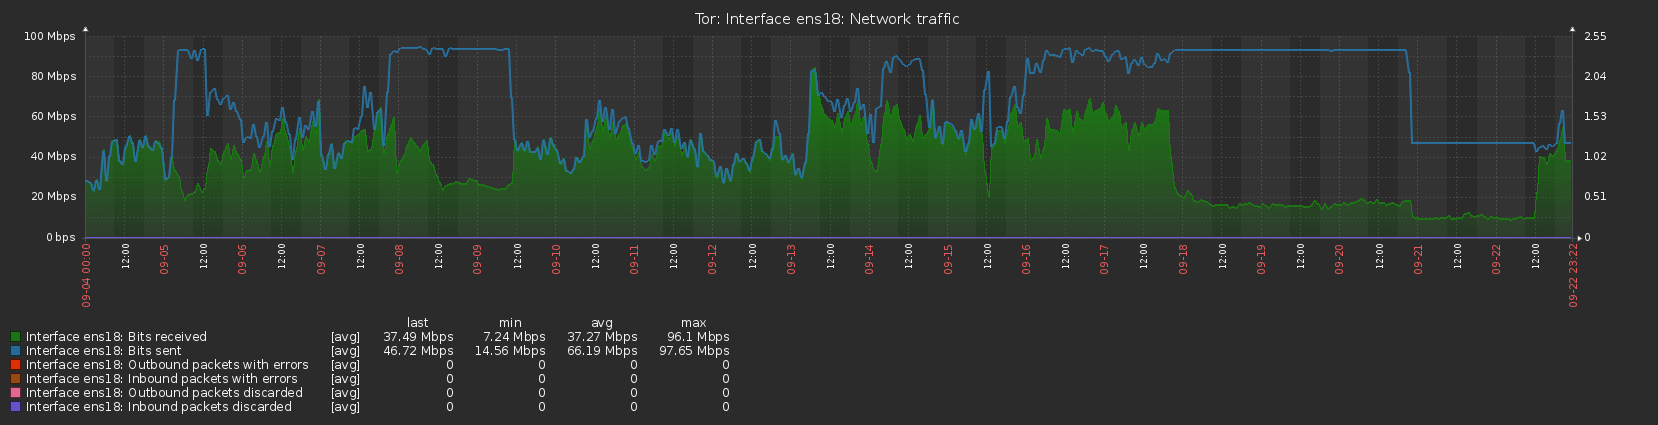
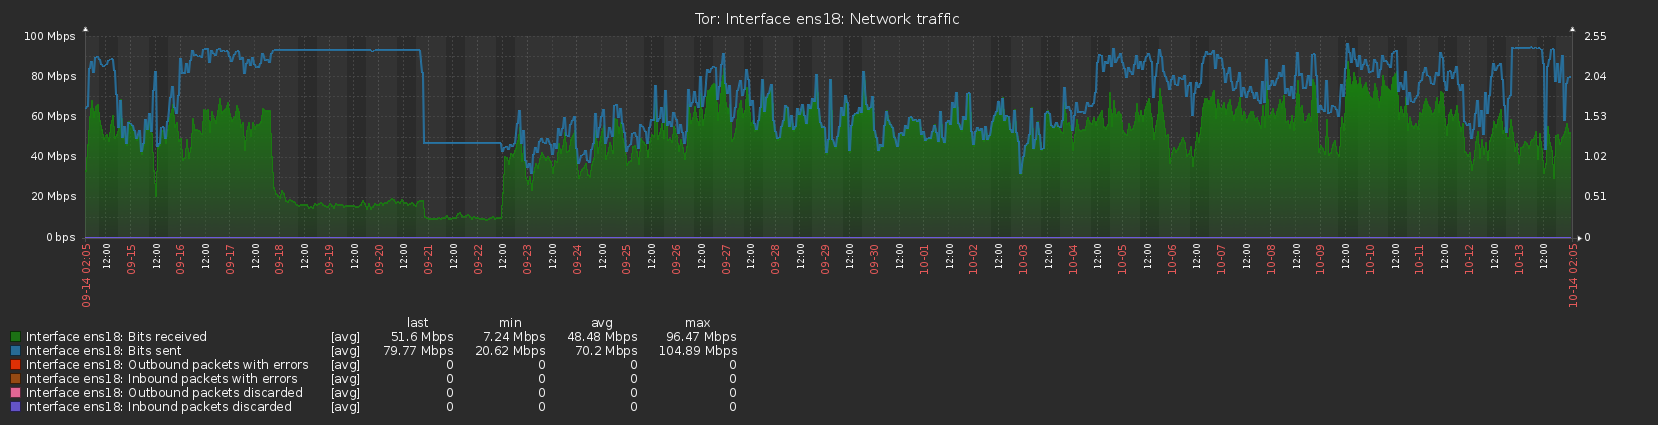
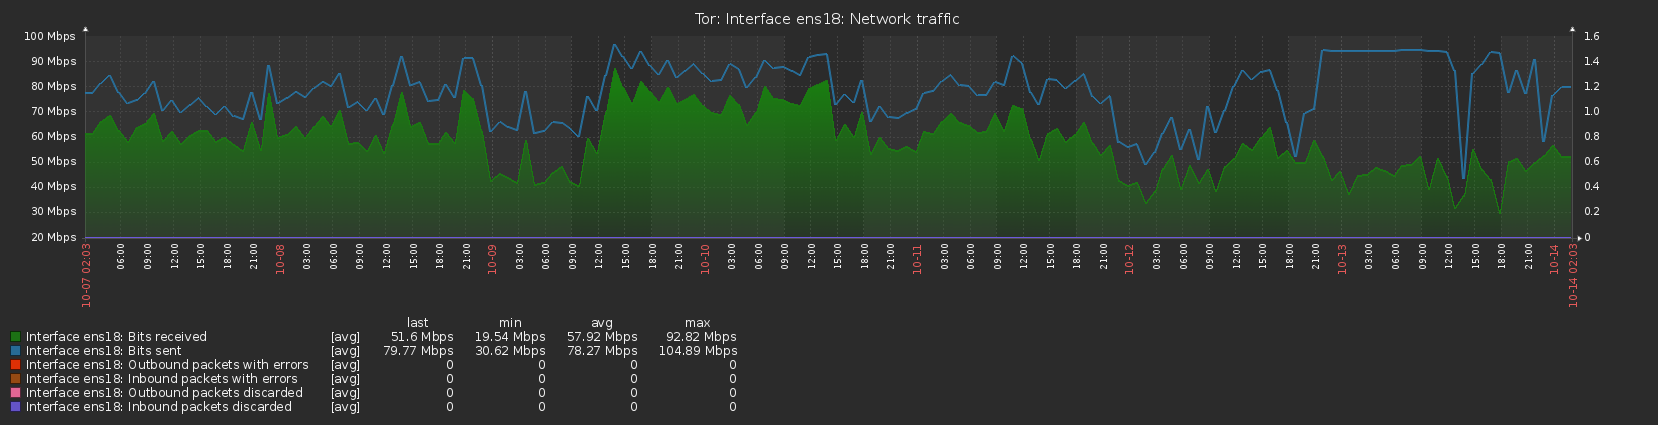
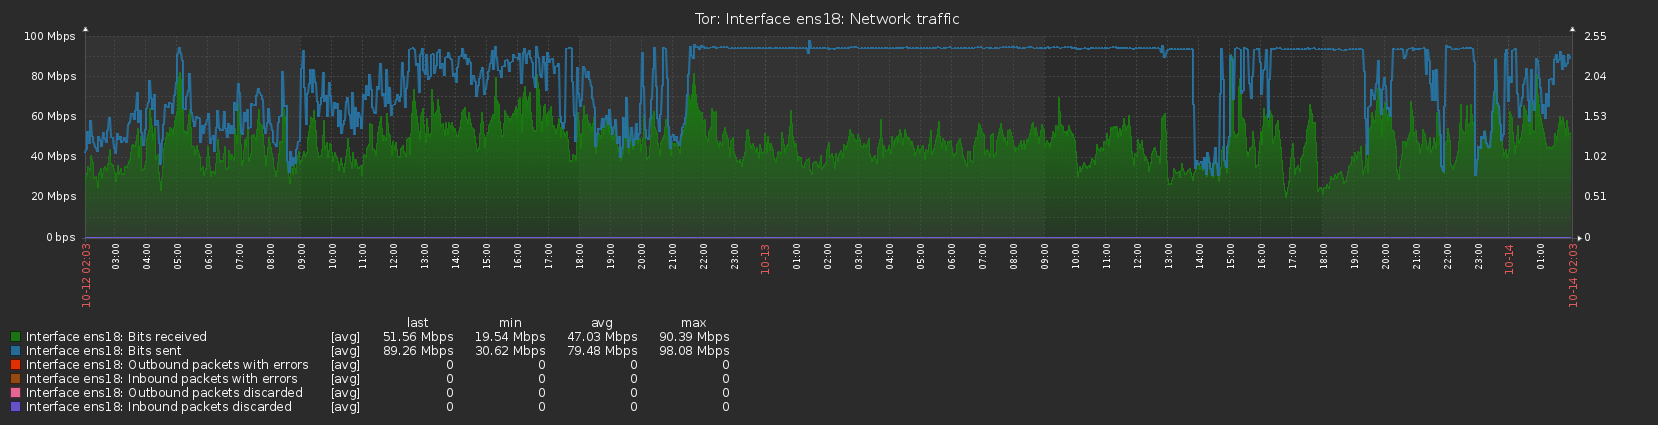
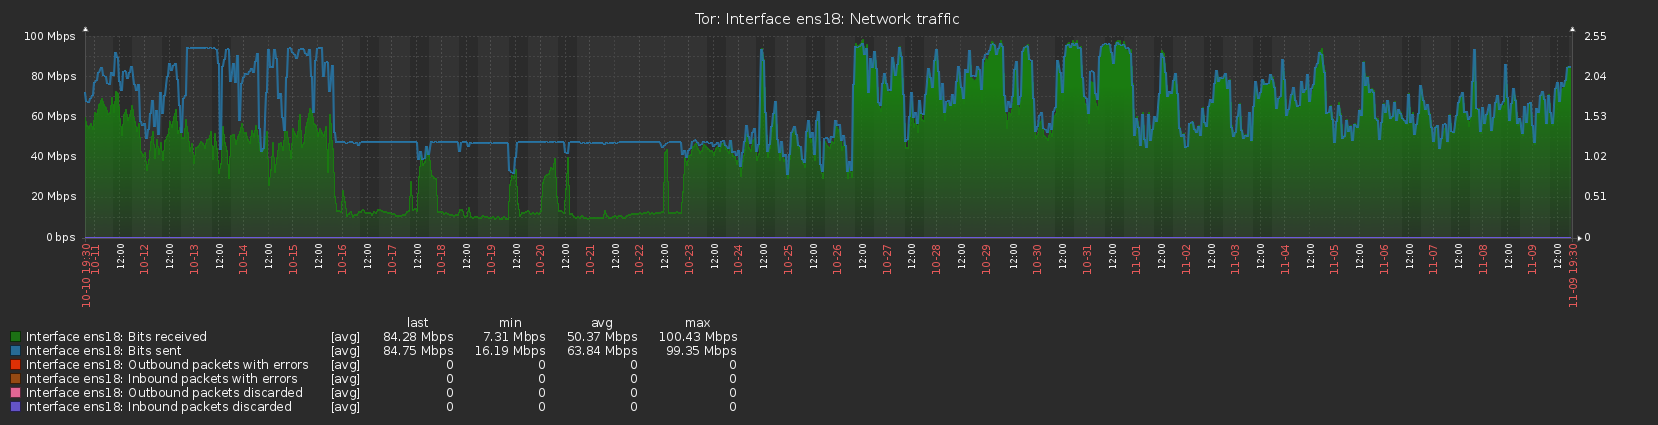
Normally the server would upload slightly more than it downloaded, totalling a few GB over the course of a day, but I am now finding that for extended periods of time the upload is fully utilised at the bandwidth cap I’ve set (12.5MB/s, peak to 25MB/s), whereas the download is way below, running at around 30% of the cap. Initially this happened right after restarting the server and I thought it may have been due to losing the guard flag (although on second thoughts that should make the traffic more evenly balanced, rather than less) but it has continued for most of the last 2 weeks, with only a 3-day window between 10/9 and 13/9 where traffic seemed to be running normally. The graphs available on the Tor Project Metrics page illustrate this imbalance with the lines showing bytes read and bytes written being significantly apart.
Can anyone explain this anomaly? Is this traffic ‘normal’ and can be safely ignored or should I undertake some further investigation? Are any other relay operators seeing anything similar?
Some details on the system:
OS: Debian 11 Bullseye - Linux 5.10.0-25-amd64 #1 SMP Debian 5.10.191-1 (2023-08-16) x86_64 GNU/Linux
Tor: 0.4.8.5 - Libevent 2.1.12-stable, OpenSSL 1.1.1n, Zlib 1.2.11, Liblzma 5.2.5, Libzstd 1.4.8 and Glibc 2.31 as libc, compiled with GCC version 10.2.1
HW: Proxmox VM with 4 VCPU, 8GB RAM, 24GB RAID10 ZFS SSD boot device.
Thanks in advance,
M