Newly installed snowflake proxy has slow speeds

Hi there,

I installed a snowflake proxy on a vps a few days ago (docker on debian). It quickly picked up traffic, but looking at the docker logs it looks very slow.

Is this normal or is there anything I can do about it?

I opened the specified port range in ufw and it’s reporting as “NAT type: unrestricted”

See attached screenshot.

1 Like

Mine look like that also. Proxy unrestrictecd on a home IPv4 using Ubuntu 22.04.4 LTS
I add up the totals and here is the last 5 days.
2026/02/13 2894875
2026/02/14 1920520
2026/02/15 2914847
2026/02/16 2310404
2026/02/17 1837423

It’s at its lowest traffic since 2024/11/29

In a way it’s nice to know that it’s not just me.

Thanks for replying.

It’s been a long time since I ran one of these and I remembered it has pushing a lot more traffic, but maybe its just the way it is?

I’m on Hetzner, btw, which I now realise is not ideal and might be blocked in some places. Not sure if thats a factor.

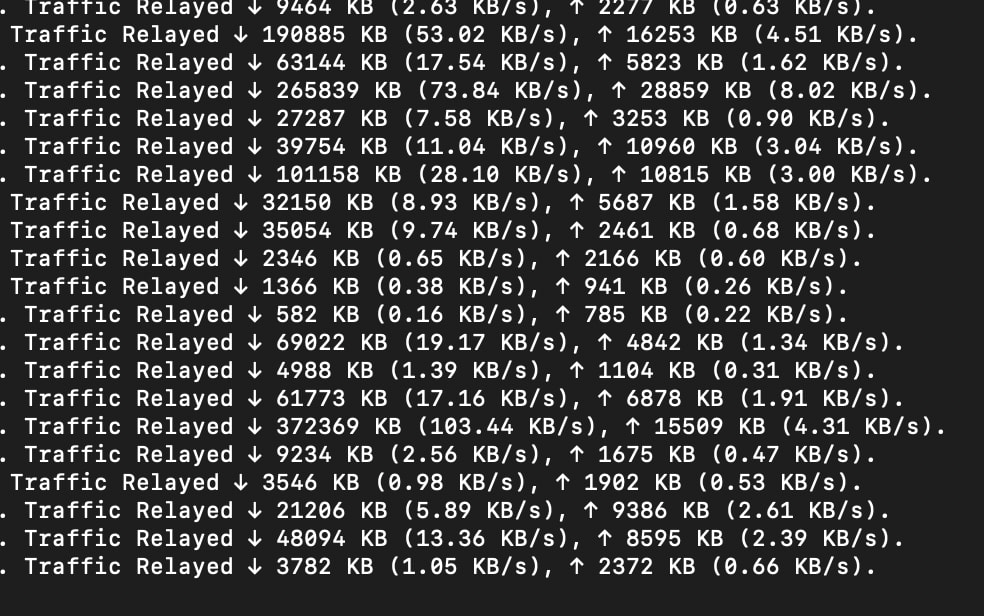
This shows not the peak bandwidth, but rather only the average traffic speed over the entire day. If a client downloads a file at 1000 KB / s for 10 seconds and then idles for 90 seconds, this will result in a speed of (1000KB/s * 10s) / (10s + 90s) = 100KB/s.

https://gitlab.torproject.org/tpo/anti-censorship/pluggable-transports/snowflake/-/blob/18dacf41dca88974be1d568d0bfd75b3f805f13b/common/event/interface.go#L111-114

Though yes, perhaps this is not intuitive

Thank you for explaining this, that’s very helpful.

Will still be interesting to see if traffic picks up, but I wont worry too much about it, then.

1 Like

There is a lot of traffic which does not make it so in your logs you will see lots of these:
Timed out waiting for client to open data channel

Plus a lot of traffic last less than ~30-35 seconds which really says, to me, no connection or blocked.

I also am running at less than what I specified in the -capacity 12 parameter. I rarely hit 12.
A quick and dirty way way to find this number is:
sudo netstat -t4u4wanp | grep -i 'proxy' | grep -i -E -c '141.212.118.18|193.187.88.42'

What is measured in the KB? The traffic to/from the remote client and the traffic to/from the the relay (01.snowflake and 02.snowflake)?

Or only to/from the remote client?

We look from the client’s perspective, so the numbers you see are roughly equal to the numbers that clients see. So it’s up / down traffic to the relay (server).
See fix(proxy): up/down traffic stats being mixed up (!130) · Merge requests · The Tor Project / Anti-censorship / Pluggable Transports / Snowflake · GitLab

So just to close this; the bandwidth use I’m seeing is what can be expected and I should just let it run like this, correct?

Thanks for your help.

This is good to know. I could see the argument from either side.
So for me, and any other proxy operator, it is ~twice the total of those 2 numbers as seen from an ISP’s measurement.

Yesterday was the lowest I’ve seen yet.

Yes, correct.