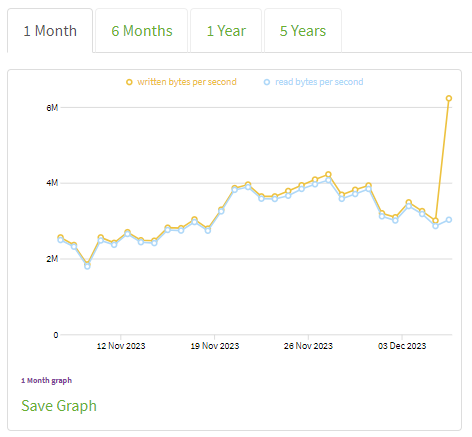
Here is new info regarding overload event for my relay.
After RAM consumption reached 5 GB, I restarted Tor service.
Instantly RAM consumption began to grow again.
When it reached 3 GB, I noticed that alive circuit count start dropping (returning to normal values), indicating that overload went away.
Then I restarted node again to clear mess in RAM and after that consumption stabilized at usual value of 600 MB.
Recently Metrics published fresh charts for traffic consumption and I can see how event reflected there for my relay:

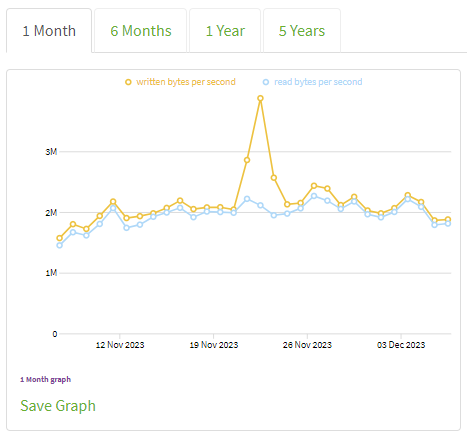
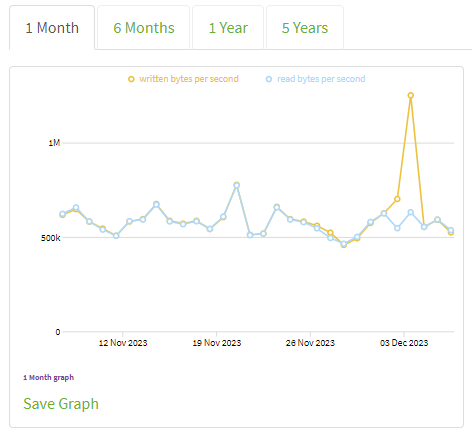
I decided to check if other relays had similar spikes and result was positive:
7155DE90C1C3C9BF4D637580C7F027E57227BD30:

80EEF5DCEC1CC6F9632B4DB40BCF022D4C027DF2:

From which I make conclusion that overloads happen to small fraction of nodes at a time, but each event create significant load on particular node.