This is a follow up to my post “I wanted to give Snowflake a try”
So I installed the extension in Firefox running 24/7 on Ubuntu 22.04.4 LTS.
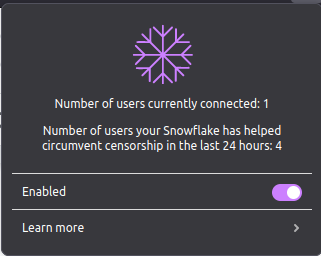
The addon has been up for at least 4 days and has not turned green. I assume once it becomes green it stays green. And gives me stats??
I read the article Snowflake, a censorship circumvention system using temporary WebRTC proxies and from that it seems there should not be a lack of requests.
How do I know this is actually working and not just wasting time? What can I check?
I see a secure TCP connection, to the Google cloud, to what I figure is the broker with traffic once in a while. There is a UDP listener 0.0.0.0:5353 attributed to Firefox and also another listener on 0.0.0.0:5353 attributed to avahi described as the Bonjour or Rendezvous protocol.
No, it’s only green when there is an active connection with a client. But it will show a number of clients served in the last 24 hours in the popup or on the icon badge (unless it’s 0).
If you’re feeling adventurous, you can go to about:debugging#/runtime/this-firefox, find Snowflake, click “inspect” and search the console messages for “websocket-relay connected!”. If that’s the case, the extension has tried to connect to a client at least once.
You should also see a bunch of “Polling broker” messages, which means that the extension is at least trying to get clients.
It disables itself. Figured it wasn’t working. I suspect the other Rendezvous process may interfere.
But my Ubuntu installation is very vanilla. So is Firefox.
What makes other people’s Snowflake work… unless they all do not know that it does not. Though on the extension page in shows enabled.
Date and time of today 2024-08-07
17:08:03.971 Snowflake: == snowflake proxy == snowflake.js:1517:13
17:08:04.455 Snowflake: Disabling Snowflake. snowflake.js:1517:13
17:08:04.455 Snowflake: Currently not active. snowflake.js:1517:13
17:08:22.367 WebRTC: ICE failed, add a TURN server and see about:webrtc for more details
17:08:32.000 Setting NAT type: restricted snowflake.js:1268:15
It may be better debugging this on a Windows machine. There is no one doing Rendezvous.
EDITed 7-Aug-2024 23:47 UTC-4
I disabled the Rendezvous process on Ubuntu and tested again. It’s the same as above so it’s not that.
I did not miss the consent prompt. Each time I checked the browser the extension was enabled.
This is twice you mentioned popup. I see no popup.
I find it strange that about:debugging#/runtime/this-firefox is not mentioned anywhere in the Snowflake docs (yes, I know it is part of Firefox) but could be mentioned to test if all is working or better yet why is there no warning when it fails. It would have been so obvious.
I have another theory which I will test today and post.
I flushed everything and started over paying close attention to a consent request and now I see different results.
So I musta missed the consent. It’s really easy to miss unless you are looking for it like I just did.
It should be in your face when you you add the extension or very obvious by itself and not below the fold half way down a web page thanking you for installing Snowflake. I wonder how many people miss it.
It should not say enabled when you look at the extension menu and should raise a flag when not working.
I see no popup when I click the icon anywhere I see it. Maybe it only works once you have actually helped someone.
This was on a test machine. Now to try this on a real machine running 24/7.
I turned on all the options in the logs and made it persistent (for now).
I still get this: WebRTC: ICE failed, add a TURN server and see about:webrtc for more details
which tells me it’s not working but I see polling which says it does:
Setting NAT type: restricted snowflake.js:1268:15
Snowflake: Snowflake IDs: 2h3uo89yfvg snowflake.js:1517:13
Snowflake: Polling broker… snowflake.js:1517:13
NAT type: restricted snowflake.js:612:13
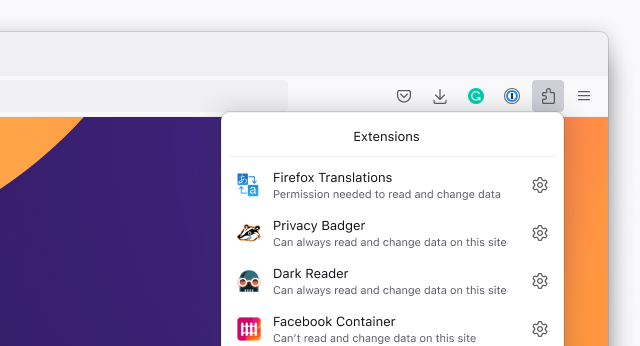
Let me start off by saying I found that menu item yesterday to show the green status. I clicked everything in sight. Ah the jigsaw puzzle icon. How obvious. (I’m being facetious here). I use Ctrl+Shift+A when I want to go to extensions or the menu Tools/Settings
I kind of figured that out by looking more carefully at the logs but it should not be in red. Red says red alert with sirens blaring and flashing lights. Just a warning would do or just stating it would do. The paper I mentioned above clearly states this can happen. (I had to read it again of course)
I gave 2 solutions for the consent thing. One is coding and the other a webpage change (easy). Another is to directly say so on the addon page in big bold letters that by adding the Snowlake extension you directly consent to blah blah blah politics politics etc etc and then make it the default.
AH I see you use Privacy Badger too.
I also came up with another problem which might not fit within this thread. Either the extension hangs or the inspector hangs. I suspect the former. Maybe I will spin this off on new thread. I kept logs.
In reading those logs I see IP addresses of potential clients and they are all in those repressive countries we talk about who say they are not but where using Tor can land you in jail.
Now, if I can see these, what stops agents of those repressive countries from doing the same and taking action.
There sure seems to be many IFs, ANDs, ORs, ELSEs, BUTs and GOTCHAs on this thing.
A good idea but the purpose of these machines is to do community computing in the medical and health science field for three different research centers. I figured one could be a Snowflake proxy via Firefox since that would not be heavy on resources.
@BobbyB i don’t know what hardware resource do you have but since it’s for medical research (i guess BOINC on somethign similar) you have for sure more resources than my “Pico” machine used exclusively for snowflake
Also if you see like 1000 users are connecting to your standalone snowflake and this number of users will take a lot of resouces you can limit the number of users to 100 and again the resources won’t bee as much.
Have a 2nd and 3rd thought. If my little CPU can sustain 100-200users/hour on my dedicate Snowflake box your monster CPU can as well. If you see that more than 300users are connecting you can limit from the config to have a maximum on 100-200 users (but i think your machine can have at least 500users and the BOINC study won’t be affected) With plugin in browser you can help 30-40 users/24 hour but with a standalone you can help 100-200 x24 users
You are correct, maybe I could give this a try. Will have to use a test machine though. I consider these Boinc machines as production and don’t play with them.
Depends on how complex it gets. If I see the word compile or any weird stuff it’s a no-go. If I like what I see then I could go live on the 5950x.
What kind of bandwidth speed can it take with a number of clients like you mention. I only have a 10 Mbps upload capacity with which I could push stuff to clients.
If I do go live then I will post here unless they close this thread.
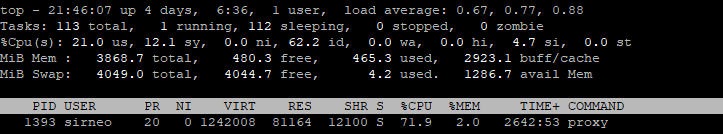
Speedometer reports between 256 KiB/s to 1.5 MiB/s (average i see is around 512 KiB/sec) Snowflake log extract to see the number of users/bandwith
2024/08/15 10:59:49 In the last 1h0m0s, there were 127 completed connections. Traffic Relayed ↓ 1558976 KB, ↑ 164499 KB.
2024/08/15 11:59:49 In the last 1h0m0s, there were 96 completed connections. Traffic Relayed ↓ 1409649 KB, ↑ 145154 KB.
2024/08/15 12:59:49 In the last 1h0m0s, there were 87 completed connections. Traffic Relayed ↓ 1771196 KB, ↑ 181810 K
Iftop just confirms what Speedometer and Snowflake log has reported
I installed it on a test machine with no problems.
systemctl status snowflake-proxy shows that it is up
It was up for 2 hours and I saw not one blip to indicate that it was working like the extension does. The only tool seems to be journalctl. Getting the right args to see what you want takes a bit of fiddling with options. And even then it’s like working in the dark ages with DOS.
So how do you know it is working. Where are those logs.
I have the setup on docker so is easy docker logs snowflake-proxy for you journalctl -u snowflake-proxy doesn’t do anything? or cat /home/bobbyb/snowflake/proxy/snowflake.log
systemctl status snowflake-proxy tells me it has started.
journalctl -u -f snowflake-proxy shows me that it is started just like the extension does but there is no continuous logging to the broker (I assume broker). It just sits there ending with: NAT type: restricted (same network so same NAT type as the extension and it works)
Even tcpdump shows nothing.
I will need to change the startup script to create a log in my home directory