We just released Onionprobe 1.2.0, a tool for testing and monitoring the
status of Onion Services.
This release requires a database migration for those using the monitoring node:
ChangeLog
v1.2.0 - 2024-04-24
Features
-
New metrics (tpo/onion-services/onionprobe#78):
- From the outer descriptor wrapper:
descriptor-lifetime.revision-counter.
- From the second layer of encryption:
single-onion-service.pow-params.
- HSDir latency when fetching descriptors.
- From the outer descriptor wrapper:
-
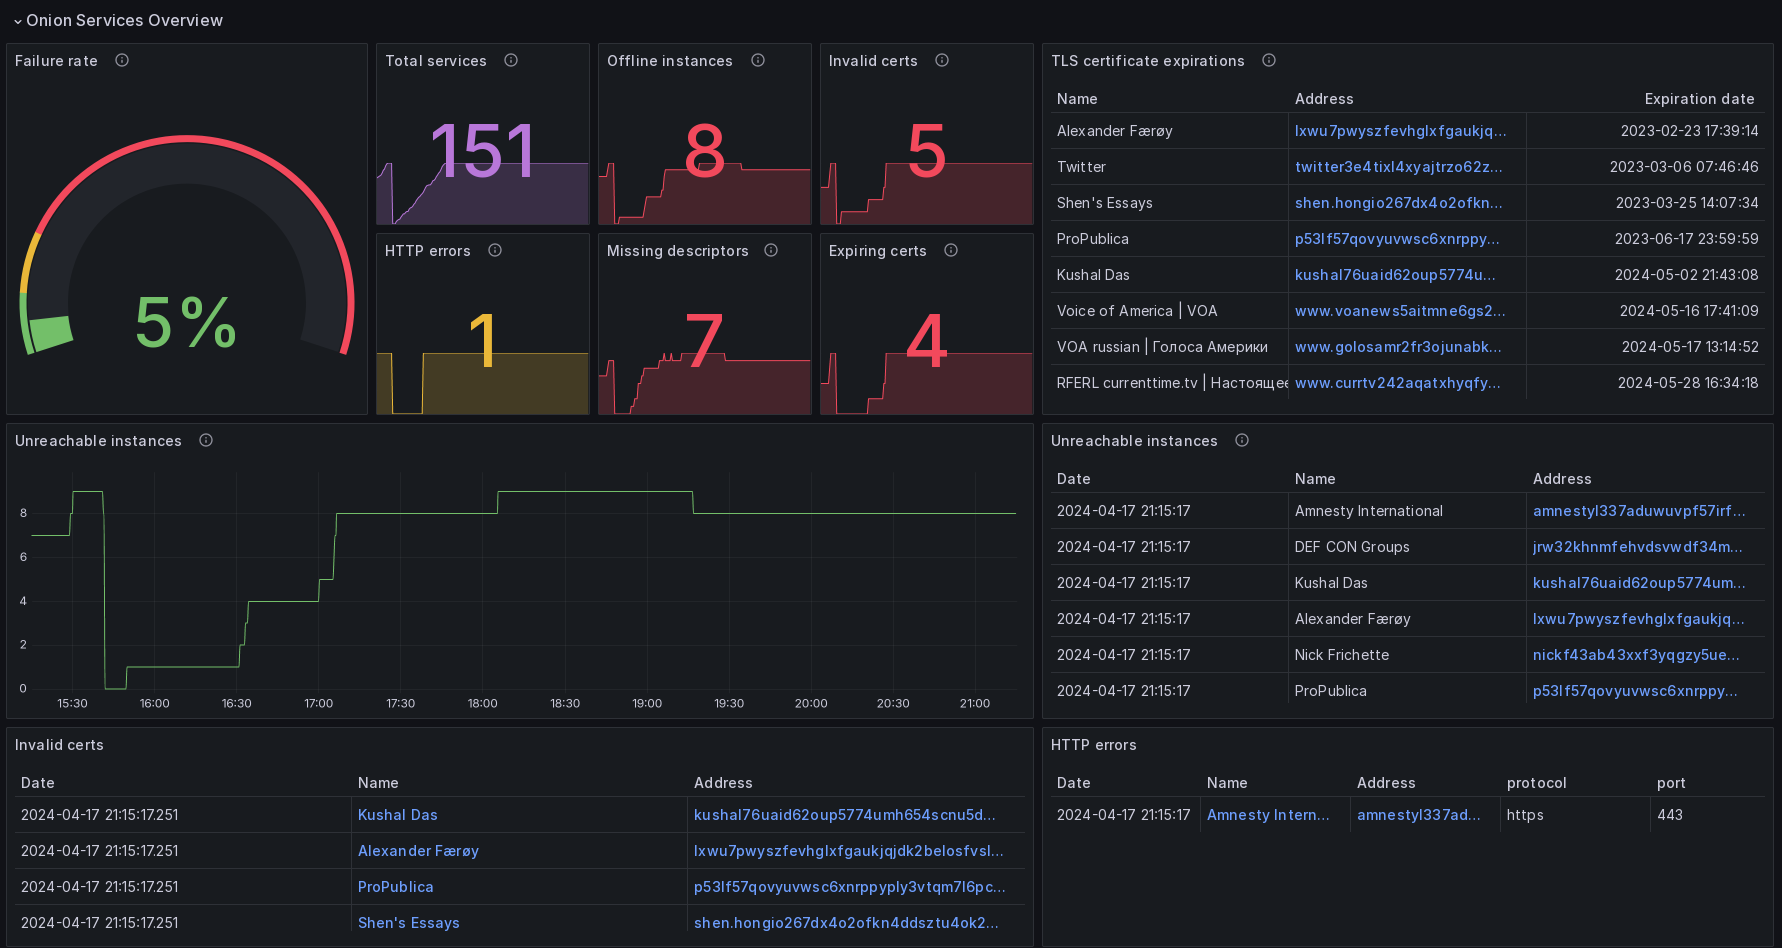
Enhanced Grafana Dashboard (tpo/onion-services/onionprobe#80) with the
following new visualizations:- Overview:
- Current failure rate of onionsites.
- Total expiring certificates in the next 7 days.
- List of certificate expirations up to the next 180 days.
- List of unreachable instances.
- Graph with the total unreachable instances.
- List of invalid HTTPS certificates.
- List of services with HTTPS errors.
- Performance:
- Total of minimum, average and maximum service connection latency.
- Total of minimum, average and maximum descriptor fetch latency.
- Chart of minimum, average and maximum service connection latency.
- Chart of minimum, average and maximum descriptor fetch latency.
- Rate of services using the single hop mode, relative to the total services monitored.
- List of slow services.
- Descriptors:
- List of services missing a published descriptor.
- Chart of the minimum, average and maximum descriptor sizes (decrypted outer layer).
- Chart of the minimum, average and maximum descriptor sizes (decrypted second layer).
- Introduction points:
- Chart of minimum, average and maximum number of introduction points per service.
- List of services and it’s number of introduction points.
- HSDir:
- Total number of HSDirs tested.
- Chart of minimum, average and maximum HSDir latency for fetching descriptors.
- List of HSDirs sorted by descriptor fetch latency.
- Proof of Work (PoW):
- Ratio of services with PoW enabled, relative to the total services monitored.
- Total number of services with PoW enabled.
- Chart of minimum, average and maximum PoW v1 effort seem.
- List of services with PoW enabled.
- List of services with PoW enabled with effort greater than zero.
- Overview:
-
Improved log message for elapsed time.
-
New log messages for:
- Number of introduction points.
- HS_DESC events:
- Descriptor reachability.
- HSDir used.
-
Create a GitLab release at every new tag (experimental)
(tpo/onion-services/onionprobe#82). -
Running lintian on CI to check the generated Debian package.
Fixes
-
Manpage generation is now compatible with the Onion Services
Ecosystem Portal (tpo/onion-services/ecosystem#1). -
Use the correct copyright line in source files.
-
Support for a wider range of pyca/cryptography versions at
setup.cfg. -
Display Tor bootstrap messages only for the debug log level.
-
Disable stem logging if log level is below debug (tpo/onion-services/onionprobe#63).
-
Exit codes now reflects reality (tpo/onion-services/onionprobe#64).
-
Calculate the elapsed time for descriptors right after fetching.
-
Updated the SecureDrop list.
-
Upgraded Grafana image to 10.4.2.
-
Upgraded Alertmanager image to 0.27.0.
-
Upgraded Prometheus image to 2.51.2.
-
Upgraded PostgreSQL image to 16.
Please run the needed upgrading steps. -
Upgraded CI and container images to Debian bookworm.
-
Upgraded
vendors/onion-mkdocs.