Possible false downtime / StaleDesc issue affecting Tor relay statistics

Hello,

I am operating a Tor relay and have noticed what appears to be an inconsistency between the relay’s actual operation and the availability, stability, and traffic information shown by Tor Metrics.

Relay

Nickname: MyRelay1
Fingerprint: 169177534472CC9EB599780EC337A558B7752F58
ORPort: 9001
Tor version: 0.4.9.11
Platform: Linux
Configuration: PublishServerDescriptor 1

The relay is running as a native systemd instance:

tor@default.service

It is not running in Docker.

Actual relay uptime and traffic

The relay has been continuously running for more than two months.

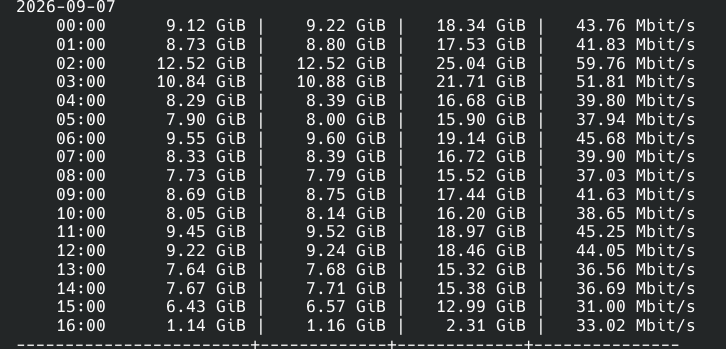
During this entire period, it has continued to pass Tor traffic. Local vnStat measurements typically show approximately 25–60 Mbit/s, with the best observed hourly average around 59 Mbit/s.

vnStat currently reports approximately 21 TiB of total RX+TX traffic. There is very little other network activity on this machine, so the vast majority of this traffic appears to be associated with the relay.

Therefore, the relay was clearly active even during periods where Tor Metrics appeared to report downtime.

Strange downtime pattern

Tor Metrics previously showed repeated downtime periods with a very unusual pattern.

The reported downtime would:

  • start exactly on the hour, e.g. 14:00
  • last approximately 1 hour 40 minutes, or sometimes 2 hours 40 minutes
  • then the relay would suddenly appear UP again

For example:

14:00  DOWN
15:40  UP

or:

14:00  DOWN
16:40  UP

This happened repeatedly.

The important point is that the relay itself did not actually go down during these periods. vnStat continued to show substantial traffic throughout them.

The exact-hour start and highly repetitive 1h40m / 2h40m durations made this look more like a monitoring, measurement, directory, or Metrics-related issue than an actual network outage.

I contacted the relevant support/contact address about this. A few days later, the recurring hourly downtime pattern disappeared, although I did not make any configuration changes to the relay.

StaleDesc

Shortly afterwards, the relay received a StaleDesc flag.

I performed a soft restart of the Tor process. I did not reboot the VPS and did not change the Tor configuration.

The StaleDesc flag disappeared within approximately two hours after the restart.

The relay’s long-term uptime shown by Metrics remained intact.

Later, StaleDesc appeared again.

At that point I deliberately did not restart the relay again, because I wanted to observe whether the condition would resolve by itself.

The StaleDesc flag has since disappeared again without another restart.

This makes me wonder whether the restart was actually fixing an underlying relay problem, or whether it was simply coinciding with a delayed update in the directory/Metrics system.

Current Tor logs

The local Tor instance does not report any warning-level problems.

The relevant systemd service is:

tor@default.service

and it is currently:

active (running)

The parent tor.service is the multi-instance master and is active (exited), while tor@default.service is the actual running Tor instance.

The following command produced no warnings:

sudo journalctl -u tor@default --since "24 hours ago" -p warning

Output:

-- No entries --

The Tor log also shows regular descriptor uploads:

Sep 06 18:46:34 ... server descriptor upload: 67083 bytes
Sep 07 00:46:25 ... server descriptor upload: 67083 bytes
Sep 07 06:46:32 ... server descriptor upload: 67083 bytes
Sep 07 12:46:32 ... server descriptor upload: 67143 bytes

It also shows normal consensus, authority certificate, and microdescriptor fetching.

There are no obvious descriptor upload errors in the local logs.

Configuration

Relevant relay configuration:

ORPort 9001
Nickname MyRelay1
PublishServerDescriptor 1

The configuration validates successfully:

sudo tor --verify-config

Output:

Read configuration file "/etc/tor/torrc".
Configuration was valid

The system clock has also been checked and is correctly synchronized, so an incorrect local clock does not appear to explain the issue.

Authority / Metrics observations

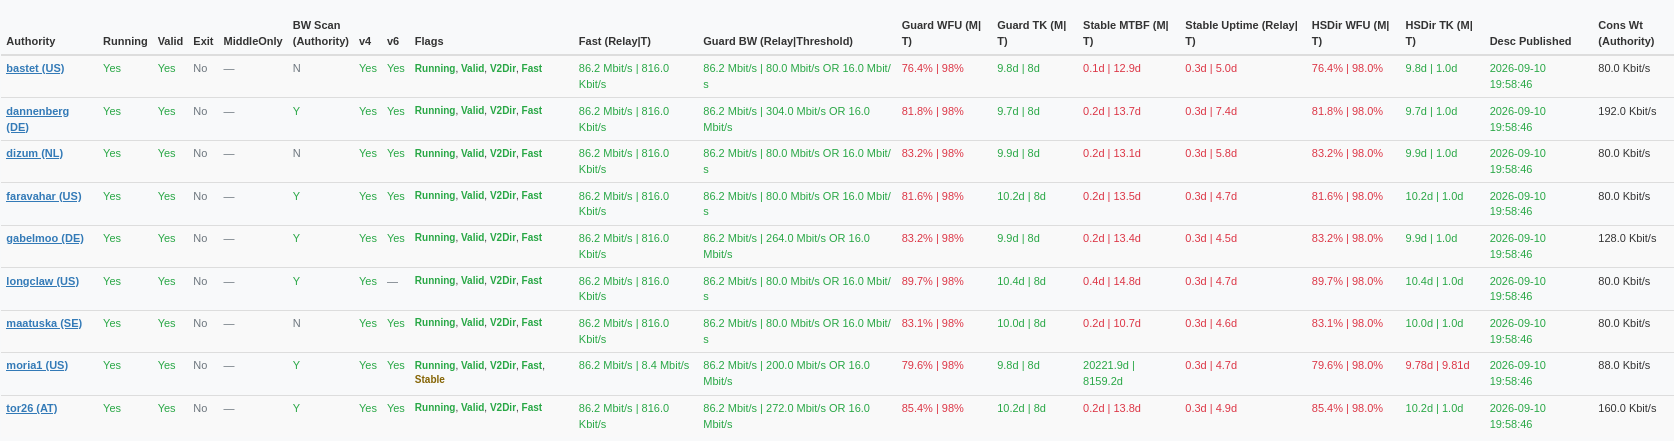
The relay has been observed as Running, Valid, V2Dir, and Fast by the directory authorities.

However, the stability information shown by Metrics has been surprisingly poor compared with the actual continuous uptime.

In particular, the relay has shown approximately:

  • WFU around 70–86%
  • very low MTBF compared with the actual >2 month continuous uptime
  • inconsistent Stable/Guard status

This seems difficult to reconcile with the actual relay behavior and continuous traffic.

There has also been a large discrepancy between the relay’s actual observed traffic and some reported bandwidth measurements. The relay is routinely handling tens of Mbit/s, while some authority bandwidth measurements have appeared to be only around hundreds of Kbit/s.

I understand that local vnStat RX+TX totals and Tor Metrics’ Data Transferred value may use different accounting methods, so I am not assuming that those values should match exactly.

Data Transferred update behavior

There is also an interesting update-related observation.

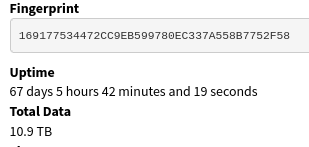
On the official Tor Metrics site, the displayed Data Transferred value was approximately 10.3 TB before the soft restart.

After the restart, it increased to approximately 10.7 TB.

Since then, the displayed total has not updated for approximately 20 hours, despite the relay continuing to transfer substantial traffic according to local vnStat measurements.

At the same time, the traffic graph on Metrics continues to update and has increased slightly.

This makes me wonder whether the Data Transferred total is being updated through a different process or on a different schedule than the traffic graph.

Questions

Could someone please check whether there is an issue somewhere in the directory authority / bandwidth measurement / Onionoo / Metrics pipeline for this relay?

In particular:

  1. Why would Metrics report repeated downtime starting exactly at HH:00 and ending after approximately 1h40m or 2h40m, while the relay continued passing substantial traffic?

  2. Why did the relay receive StaleDesc even though its local logs showed regular server descriptor uploads and no warnings?

  3. Could stale or missing authority observations be affecting the relay’s WFU/MTBF/Stable calculations?

  4. Could the previous apparent downtime and the StaleDesc condition be related?

  5. Could the apparently incorrect availability observations explain the unusually low WFU/MTBF and inconsistent Stable/Guard status?

  6. Why did Data Transferred increase immediately after the soft restart, but then stop updating for approximately 20 hours while the traffic graph continued to update?

  7. Is there anything on the authority/Metrics side that could cause these observations to differ substantially from the relay’s actual availability and traffic?

I would prefer not to restart the relay again unless necessary, since it has a long continuous uptime and the relay itself appears healthy.

I can provide additional timestamps, Metrics screenshots, local logs, or other diagnostic information if needed.

Thank you.
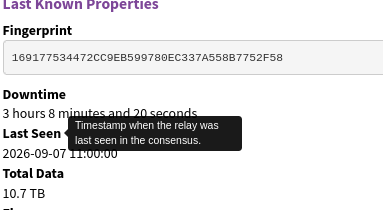

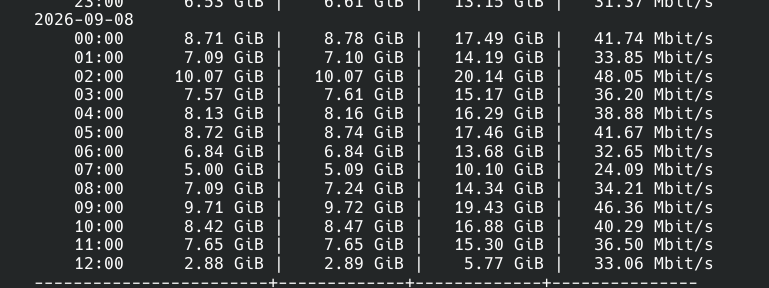
From my perspective the downtime was about 50mins. You can see that the total data updated when i came back online. It was stuck since yesterday. From the last photo you see i was moving data all the time. The vps only runs tor as a service

I can already see the same is gonna happen today. The total data has not updated and the relay has been running all night given the se estimate about 400gb for total today.

jorma:

From my perspective the downtime was about 50mins. You can see that the total data updated when i came back online. It was stuck since yesterday. From the last photo you see i was moving data all the time. The vps only runs tor as a service

I was looking at the votes from our directory authorities for the last
week and what they have to say about your relay and there is indeed
almost no hour where at least one authority can’t reach your relay and
is therefore withholding the Running flag. Often it is more than one and
sometimes even a majority leading to your relay not being included in
the consensus.

Additionally, it seems your relay has sometimes trouble even publishing
a descriptor to the directory authorities (hence your StaleDesc flag).

I don’t have access to any of the authority side of the logs, so it’s
not clear what is going on on their side but you could maybe start
logging at info level and see whether you find anything suspicious, in
particular around descriptor publishing times. Additionally, maybe doing
some traceroutes to the directory authorities from your relay box might
help you understand whether there are some bottlenecks from your side
and where they are (in particular around the time a server descriptors
is supposed to be published but fails).

And, like I said, it happened again.

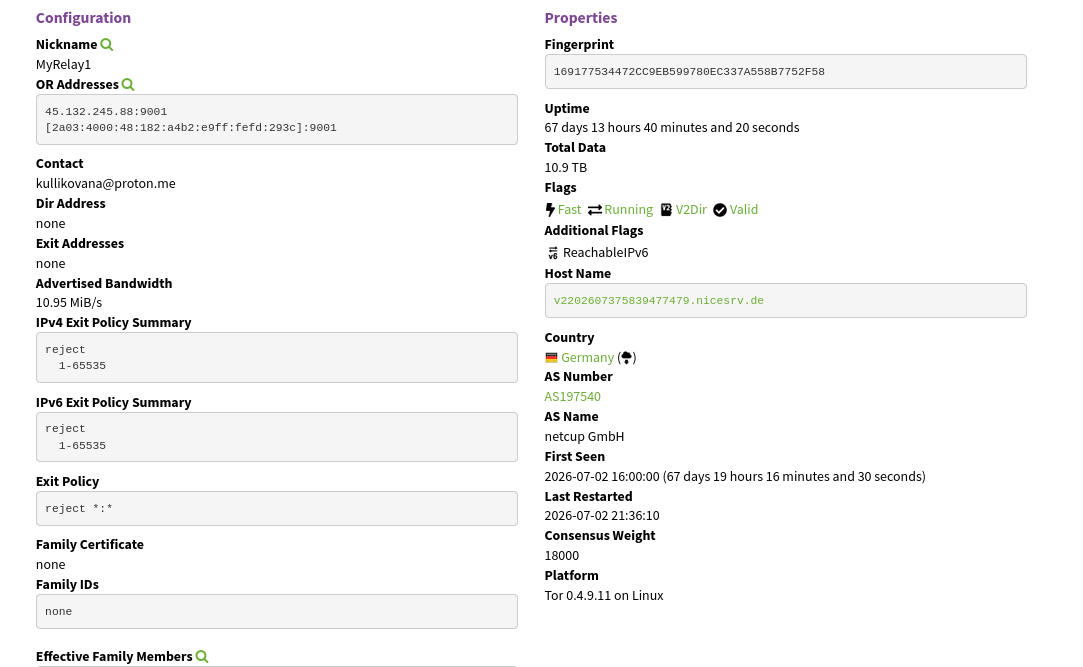
The relay has continued to handle traffic normally from my side, but the directory/metrics side is currently showing it as down. The last seen time is 08:00, while the VPS has continued to transfer several GB of traffic every hour after that.

I’ve attached screenshots showing the current relay status and the local traffic statistics.

This has now happened repeatedly. The VPS is already paid for for a full year, and my intention was simply to let it run as a Tor relay.

I would be happy to get the relay working properly, but I don’t have the time or expertise to do deep debugging at the authority/network level. If there is something specific you want me to check on the relay, I’m happy to do so, but I need some guidance on what to look for.

ps. Now it came back again and total data didnt update.

Yeh it seems nobody cares from tor project. Its cheap vps ill just let it run and abandon it. Nobody cares about nothing anymore. You dont get any answers from anywhere like my main chat has been lost at Xai. two month and one answer. “yeh we look into it” and every week i ask what is the situation.

Same everywhere. Im gonna just start running everything locally what i possible can.

···

Sent with Proton Mail secure email.

On Tuesday, September 8th, 2026 at 10:10 AM, Georg Koppen noreply@forum.torproject.org wrote:

Someone replied to your post.

GeKo
September 8

jorma:

From my perspective the downtime was about 50mins. You can see that the total data updated when i came back online. It was stuck since yesterday. From the last photo you see i was moving data all the time. The vps only runs tor as a service

I was looking at the votes from our directory authorities for the last
week and what they have to say about your relay and there is indeed
almost no hour where at least one authority can’t reach your relay and
is therefore withholding the Running flag. Often it is more than one and
sometimes even a majority leading to your relay not being included in
the consensus.

Additionally, it seems your relay has sometimes trouble even publishing
a descriptor to the directory authorities (hence your StaleDesc flag).

I don’t have access to any of the authority side of the logs, so it’s
not clear what is going on on their side but you could maybe start
logging at info level and see whether you find anything suspicious, in
particular around descriptor publishing times. Additionally, maybe doing
some traceroutes to the directory authorities from your relay box might
help you understand whether there are some bottlenecks from your side
and where they are (in particular around the time a server descriptors
is supposed to be published but fails).


Visit Topic or reply to this email to respond.

To unsubscribe from these emails, click here.

jorma:

Yeh it seems nobody cares from tor project. Its cheap vps ill just let it run and abandon it. Nobody cares about nothing anymore. You dont get any answers from anywhere like my main chat has been lost at Xai. two month and one answer. “yeh we look into it” and every week i ask what is the situation.

This is a forum where fellow relay operators and other helpful people
hang out to discuss Tor related topics. They are volunteers as well and
might not have the time or expertise to help you within 24h. So, I think
being a bit more patient would be a good idea.

Additionally, I tried to help you with your problem both in private and
here in our forum. I told you things you (and only you) could do as next
steps in debugging and fixing your problem as we don’t have access to
your VPS. So, let us know what you find and we might have more ideas
narrowing the issue further down or getting it actually solved.

···

Same everywhere. Im gonna just start running everything locally what i possible can.

···

Sent with Proton Mail secure email.

On Tuesday, September 8th, 2026 at 10:10 AM, Georg Koppen noreply@forum.torproject.org wrote:

Someone replied to your post.

| GeKo
September 8 |

  • | - |

jorma:

From my perspective the downtime was about 50mins. You can see that the total data updated when i came back online. It was stuck since yesterday. From the last photo you see i was moving data all the time. The vps only runs tor as a service

I was looking at the votes from our directory authorities for the last
week and what they have to say about your relay and there is indeed
almost no hour where at least one authority can’t reach your relay and
is therefore withholding the Running flag. Often it is more than one and
sometimes even a majority leading to your relay not being included in
the consensus.

Additionally, it seems your relay has sometimes trouble even publishing
a descriptor to the directory authorities (hence your StaleDesc flag).

I don’t have access to any of the authority side of the logs, so it’s
not clear what is going on on their side but you could maybe start
logging at info level and see whether you find anything suspicious, in
particular around descriptor publishing times. Additionally, maybe doing
some traceroutes to the directory authorities from your relay box might
help you understand whether there are some bottlenecks from your side
and where they are (in particular around the time a server descriptors
is supposed to be published but fails).


Visit Topic or reply to this email to respond.

To unsubscribe from these emails, click here.

Im sorry and thanks for trying to help. When i have time i try to debug it how you told. Im just frustrated about everything. Its not a reason but my family member have cancer and my super long chat is lost in xai that means the world me.

After i updated to new version does this look more normal now? The uptime is low now because i had to boot the service with the update…