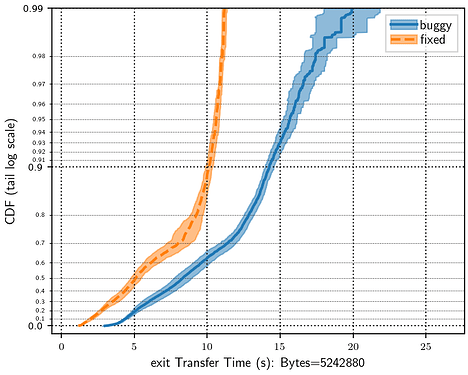
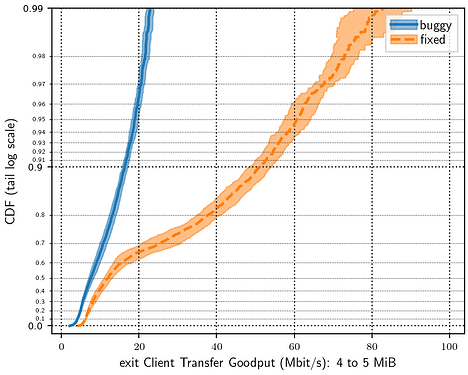
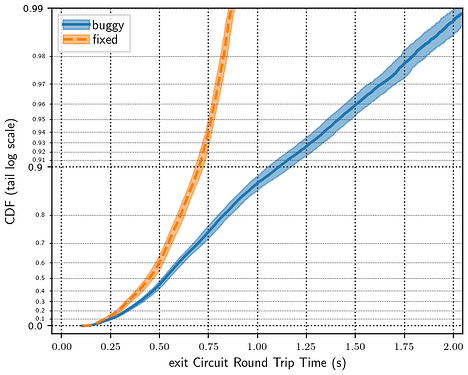
Shadow is a valuable tool for performing experiments on networks and distributed systems in a simulated environment. It has been used extensively for safe, convenient, and accessible Tor experimentation, which has led to important improvements to the Tor network. By extension, Shadow has the potential to be very useful for experimentation on pluggable transports (PTs), but there is some work that needs to be done to build and validate the simulation results for Internet-scale pluggable transport simulations.
Thanks to Jim Newsome, Steven Engler, Rob Jansen, and Justin Tracey for their work on Shadow and helping to write this post. This is a summary of a collaboration between multiple people and I hope it will inspire others to benefit from and contribute to this project.
Installing and running Shadow
See the existing Shadow documentation for details on how to install and run shadow and the necessary prerequisites. To run shadow with PTs, you will need to install tgen and tor. Instructions for how to do all of these steps are in the existing Shadow documentation and I recommend stepping through each of the examples in the subsection on running your first simulations.
For running an experiment with pluggable transports, you will need to be able to point shadow towards compiled versions of your PT. Similarly to installing tgen and tor, you will compile all necessary pieces of the PT (at minimum this should be a client and server). I find it easiest to place them in ~/.local/bin/, or another dedicated directory for Shadow binaries. You will eventually need to point Shadow towards the binary paths for each of these pieces and it is often easier to put them all in the same place.
Running a minimal PT example
The first step to running PT experiments in Shadow is to install the necessary binaries in the location of your choice (such as ~/.local/bin/), and then create a Shadow configuration file that points to these binaries and calls them with the appropriate arguments.
Pluggable transports can be run directly in Shadow without Tor by sending tgen traffic to the SOCKS listener and retrieving it from the OR port on the bridge side. Check out the minimal Snowflake example for some guidance on how this looks in the Shadow configuration file.
You need to tell tgen how to connect to the PT process. On the bridge side this is easy because the OR port is dictated by the TOR_PT_ORPORT environment variable specified in the shadow config, and this value can be used in the tgen server config. On the client side, tgen will need to connect to whichever SOCKS port the client is listening on, which is set at runtime. You can either patch the PT to always listen on the same port and then use that value in the tgen client config, or use Rob’s python script directly in the shadow config to read the port from the PT’s stdout messages and modify the tgen config before the tgen start time.
On that note, one important thing to pay attention to when configuring shadow for your PT are the start_time values for each process. For a system like Snowflake that has a lot of moving pieces, the time at which each of these pieces is started will affect the outcomes of the simulation. For example, standalone Snowflake proxies need time to complete the NAT behaviour probe test before polling the broker. To remove this latency from the results, these proxies should be started significantly before the tgen client.
Before running the minimal Snowflake example, the simulation directory will look as follows:
├── conf
│   ├── bridge-list.json
│   ├── gortcd.yml
│   ├── tgen.client.graphml.xml
│   └── tgen.server.graphml.xml
├── README.md
└── snowflake-minimal.yaml
For reasons described below, simulations of pluggable transports written in Go shoud always be run by passing the --model-unblocked-syscall-latency=true option to shadow, such as with the Snowflake example:
shadow --model-unblocked-syscall-latency=true snowflake-minimal.yaml > shadow.log
After the simulation, Shadow will produce logs from each of the configured processes in a shadow.data folder:
shadow.data
├── hosts
│   ├── broker
│   │   ├── snowflake-broker.1000.shimlog
│   │   ├── snowflake-broker.1000.stderr
│   │   └── snowflake-broker.1000.stdout
│   ├── proxy
│   │   ├── snowflake-proxy.1000.shimlog
│   │   ├── snowflake-proxy.1000.stderr
│   │   └── snowflake-proxy.1000.stdout
│   ├── snowflakeclient
│   │   ├── pt.log
│   │   ├── snowflake-client.1000.shimlog
│   │   ├── snowflake-client.1000.stderr
│   │   ├── snowflake-client.1000.stdout
│   │   ├── tgen.1005.shimlog
│   │   ├── tgen.1005.stderr
│   │   └── tgen.1005.stdout
│   ├── snowflakeserver
│   │   ├── snowflake-server.1001.shimlog
│   │   ├── snowflake-server.1001.stderr
│   │   ├── snowflake-server.1001.stdout
│   │   ├── tgen.1000.shimlog
│   │   ├── tgen.1000.stderr
│   │   └── tgen.1000.stdout
│   └── stun
│       ├── stund.1000.shimlog
│       ├── stund.1000.stderr
│       └── stund.1000.stdout
├── processed-config.yaml
└── sim-stats.json
These logs are useful for debugging problems that may arise with the simulation, and also for extracting performance measurements. See the section on visualizing results for a description on how to parse log output.
Rob has a minimal Proteus example for another point of reference. The Shadow configuration can be generated and run from the top of the repository:
cargo test -- --ignored
The generated shadow configs and simulation results will be in target/tests. For example,
$ tree target/tests/linux/shadow/tgen/simple/
target/tests/linux/shadow/tgen/simple/
├── shadow.data
│   ├── hosts
│   │   ├── client
│   │   │   ├── proteus.1000.shimlog
│   │   │   ├── proteus.1000.stderr
│   │   │   ├── proteus.1000.stdout
│   │   │   ├── python3.11.1002.shimlog
│   │   │   ├── python3.11.1002.stderr
│   │   │   ├── python3.11.1002.stdout
│   │   │   ├── tgen.1003.shimlog
│   │   │   ├── tgen.1003.stderr
│   │   │   ├── tgen.1003.stdout
│   │   │   └── tgen-client.graphml.xml
│   │   └── server
│   │       ├── proteus.1001.shimlog
│   │       ├── proteus.1001.stderr
│   │       ├── proteus.1001.stdout
│   │       ├── tgen.1000.shimlog
│   │       ├── tgen.1000.stderr
│   │       └── tgen.1000.stdout
│   ├── processed-config.yaml
│   └── sim-stats.json
├── shadow.log
├── shadow.yaml
└── tgen-client.graphml.xml.template
Running a PT with Tor
Pluggable transport processes are usually spawned by an exec system call in the main tor process. Shadow does not yet (though this is coming soon) support the syscalls necessary for subprocess creation, but PTs can still be used with tor in shadow by running them directly and providing the address to the SOCKS listener of the PT in the ClientTransportPlugin line of the torrc file. So rather than the usual line that looks like this:
ClientTransportPlugin snowflake exec ./client
we provide a line that looks like this:
ClientTransportPlugin snowflake socks5 127.0.0.1:9000
Simulations with tor also requires one of the hacks described above, to fix or discover the SOCKS port that the PT process is listening on.
See the Proteus + tor example for guidance on how to set up simulations with PTs and tor.
A more complicated Snowflake example
Similar to how Tor experiments are not accurate without a representative sample of the Tor network (see tornettools for scripts to generate accurately sampled Shadow configs), Snowflake with the size and complexity of its deployment requires some sampling to reproduce a network model that is closer to reality.
I’ve barely started working on a similar set of scripts for Snowflake simulations. At the moment, the only improvement is a sampling of Snowflake broker metrics to run multiple proxies. This simulates Snowflake without Tor at the moment and there is a lot of work needed to bring these simulations closer to reality. Ideally they should be used in conjunction with tornettools.
Visualizing results
The logs from tgen clients can be parsed to extract timing and error data. The easiest way to do this is by using tgentools. Follow the instructions for installation in the README. The parse command takes as input the tgen.*.stdout files produced in the shadow.data/hosts/client directories of the simulations, and the plot command will output several graphs based on the parsed data.
Quirks with Go
The Shadow development team has put a lot of work into getting Go binaries to run in Shadow. This includes adding support for the system calls and socket options used by the go standard library (#1540, #1558, #2980). However, there are some additional features unique to Go that PT developers should be aware of.
The Go runtime has a busy loop that causes a deadlock in Shadow due to the simulation’s interception of time. To avoid this, Shadow simulations with Go binaries should always be run with the option --model-unblocked-syscall-latency=true.
Go tends towards statically linked executables. This clashes with Shadow’s methods for intercepting system calls, which relies on LD_PRELOAD to override calls to selected functions and install a seccomp filter to intercept any other system calls not caught by the preloaded shim. Binaries that are purely statically linked will ingore the LD_PRELOAD environment variable and won’t be properly intercepted by Shadow. It turns out that the standard networking library uses libc (and some time libraries make calls to vDSO code), so this hasn’t been a concern for Go PTs yet. It’s good to be aware of, and you can force dynamically linked executables if necessary.
Speaking of the vDSO, there was a really fun problem, discovered and fixed by Jim, where time was not being intercepted for Go programs (#1948) because the initial time of day was determined by a direct call to vDSO code. vDSO functions are difficult to interpose and escape both of shadow’s methods of system call interception. Because vDSO exports what would normally be system calls to user space, the calls cannot be intercepted by the kernel’s seccomp filter. vDSO is also an exception to preferential ordering of LD_PRELOAD and will always be loaded first. It is unusual that the Go standard library is calling vDSO code directly rather than making an intermediate call to libc, which is why this problem didn’t appear before. Shadow now directly patches the loaded vDSO code to instead call the functions already intercepted by LD_PRELOAD, and this is not something that PT developers need to worry about.
Shortcomings and planned work
The network model and the Snowflake configuration are not yet ready for anti-censorship science.
I’m planning to update this thread with finished improvements, but I want to outline the planned work here so that anyone intending to use shadow for PT experiments is aware of the current shortcomings.
Modelling instability in transnational internet links
The network model currently suggested for Tor experimentation in Shadow was constructed using RIPE Atlas probes to determine the latency, and speedtest.net to determine the bandwidth of the edges connecting a network graph of over 1000 cities. Packet loss was originally set as a function of the latency for that edge because no packet loss data was available at that time.
Recent work on measuring transnational Internet performance has shown that some links exhibit a much higher packet loss rate than the rest of the world, where packet loss rates are very low. They also found that loss rates were not symmetrical. For example, traffic entering China is dropped at a higher rate than traffic leaving. Many of the countries that were studied in this work have also performed some kind of Internet filtering that resulted in the increased use of anti-censorship tools. For these reasons, accurately modelling packet loss rates is critically important for improving the performance of anti-censorship tools in places where they are needed.
Validating the accuracy of simulated Go programs
No simulation is going to be 100% accurate, and our goal is to make sure that these simulations are accurate enough to learn what we need to learn in order to make performance improvements to anti-censorship tools. Some validation experiments would be useful here, perhaps by comparing Snowflake simulation results to live network measurements. Snowflake uses UDP for the majority of traffic, which has not been investigated as closely in Shadow as TCP has. Given what we’ve seen so far about the differences between running Go, Rust, and C programs in Shadow, it’s worth a closer look to make sure we’re really catching everything we need.
Sampling the snowflake network
As discussed above, the current sampling of the Snowflake network is a first stab at producing a more realistic simulation. The residential networks that many Snowflake proxies are running on may have different latency and packet loss characteristics than the RIPE Atlas nodes used to construct the network graph model. We could consider some validation work and explore other data sources or experiments for constructing a Snowflake proxy network model.
Similar to the Once is Never Enough paper, it’s probably a good idea to do some experimentation and validation on what percentage of the Snowflake network we should be sampling to produce accurate results. There are more Snowflake proxies than there are Tor relays at the moment, so simulating the entire network is almost certainly out of the question on any reasonable hardware. There is a tradeoff between the accuracy of experiments and the hardware resources required to run them. Ideally, we would be able to find a scaling that is accurate enough to run on an average laptop so that anyone can run performance experiments without access to large machines, but as the Once is Never Enough paper found, sampling the Tor network at 1% (which requires up to 30GB of RAM) isn’t always enough to shrink confidence intervals to the point where conclusions can be drawn. This being said, small network models can still be very useful for integration testing.
Better visualizations for PT simulations
My next planned post is some experimentation results from historical Snowflake performance improvements. For that, we’ll need some scripts to visualize the output of the simulations. tornettools has some nice functionality for parsing and plotting the results of experiments and it would ideal to reuse that work for PT experimentation.


